3.8 KiB
Debugger
Deno supports V8 Inspector Protocol.
It is possible to debug Deno programs using Chrome Devtools or other clients that support the protocol (eg. VSCode).
To activate debugging capabilities run Deno with --inspect or --inspect-brk
flag.
--inspect flag allows to attach debugger at any point in time, while
--inspect-brk will wait for debugger being attached and pause execution on the
first line of code.
Chrome Devtools
Let's try debugging simple program using Chrome Devtools; for this purpose we'll
use file_server.ts from
std; a simple static file server.
Use --inspect-brk flag to break execution on the first line.
$ deno run --inspect-brk --allow-read --allow-net https://deno.land/std@v0.50.0/http/file_server.ts
Debugger listening on ws://127.0.0.1:9229/ws/1e82c406-85a9-44ab-86b6-7341583480b1
Download https://deno.land/std@v0.50.0/http/file_server.ts
Compile https://deno.land/std@v0.50.0/http/file_server.ts
...
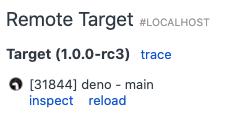
Open chrome://inspect and click Inspect next to target:
It might take a few seconds after opening the devtools to load all modules.
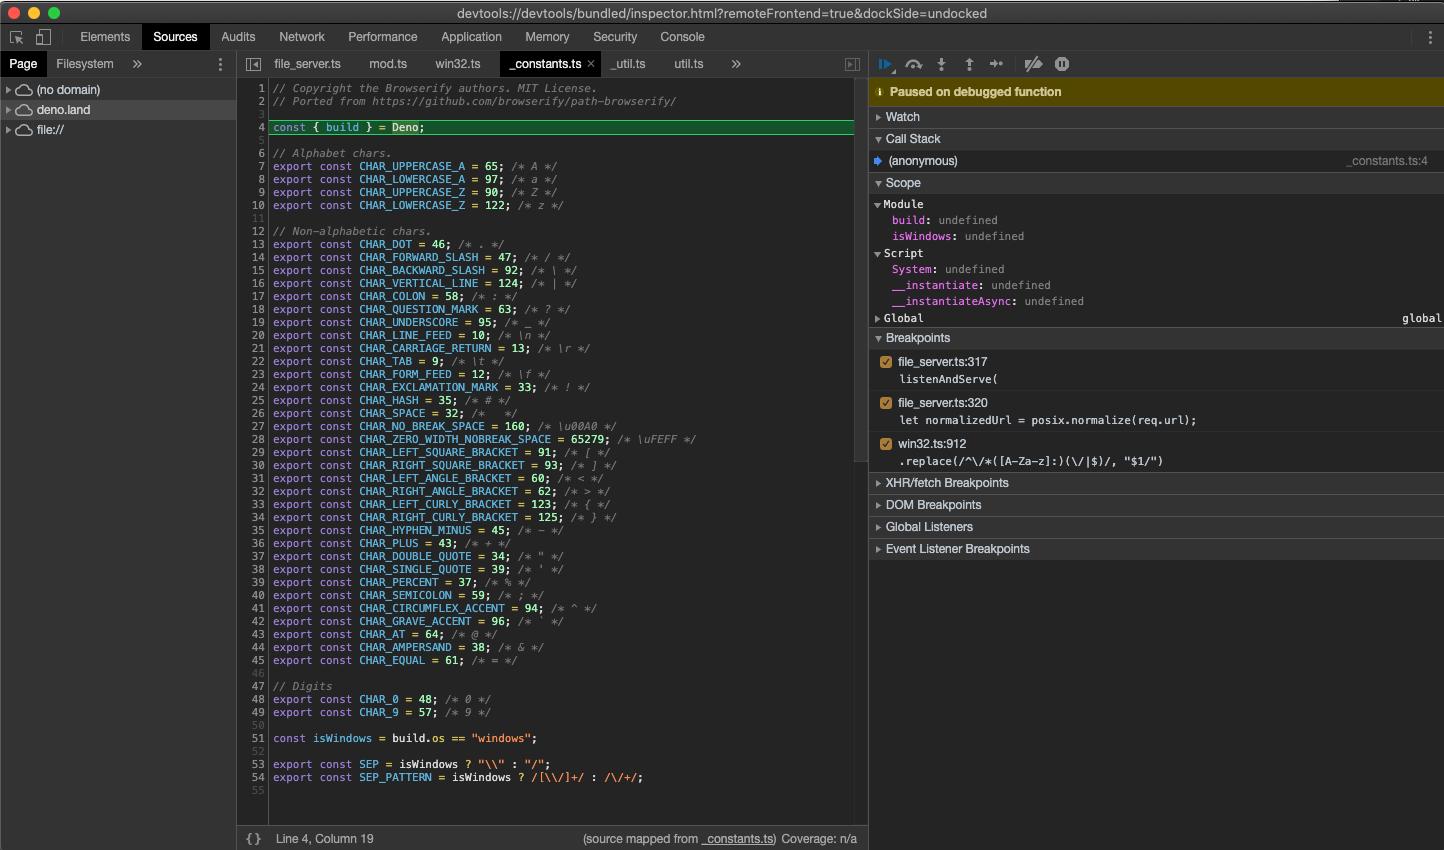
You might notice that Devtools paused execution on the first line of
_constants.ts instead of file_server.ts. This is an expected behavior and is
caused by the way ES modules are evaluated by V8 (_constants.ts is left-most,
bottom-most dependency of file_server.ts so it is evaluated first).
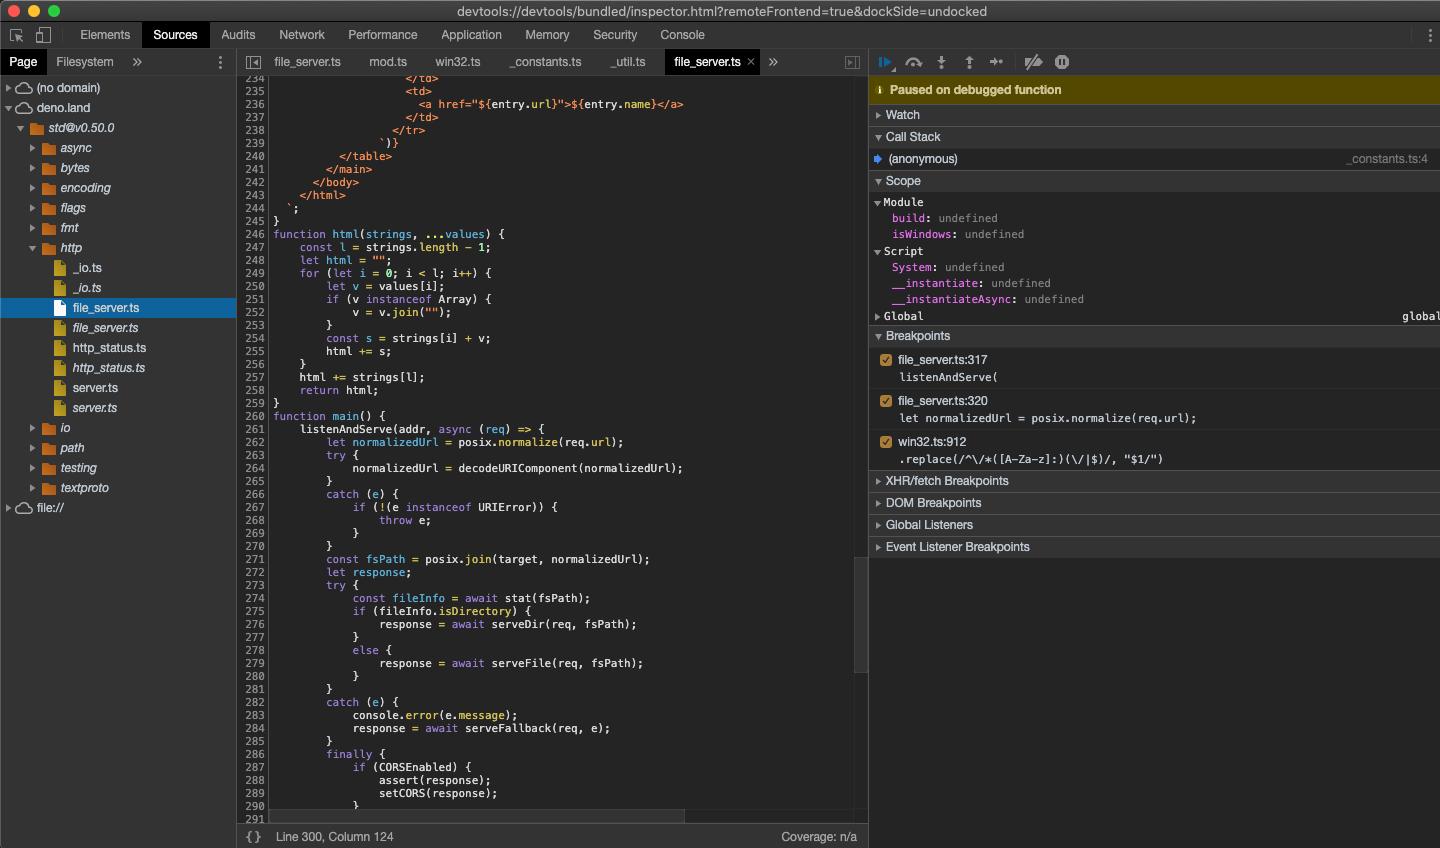
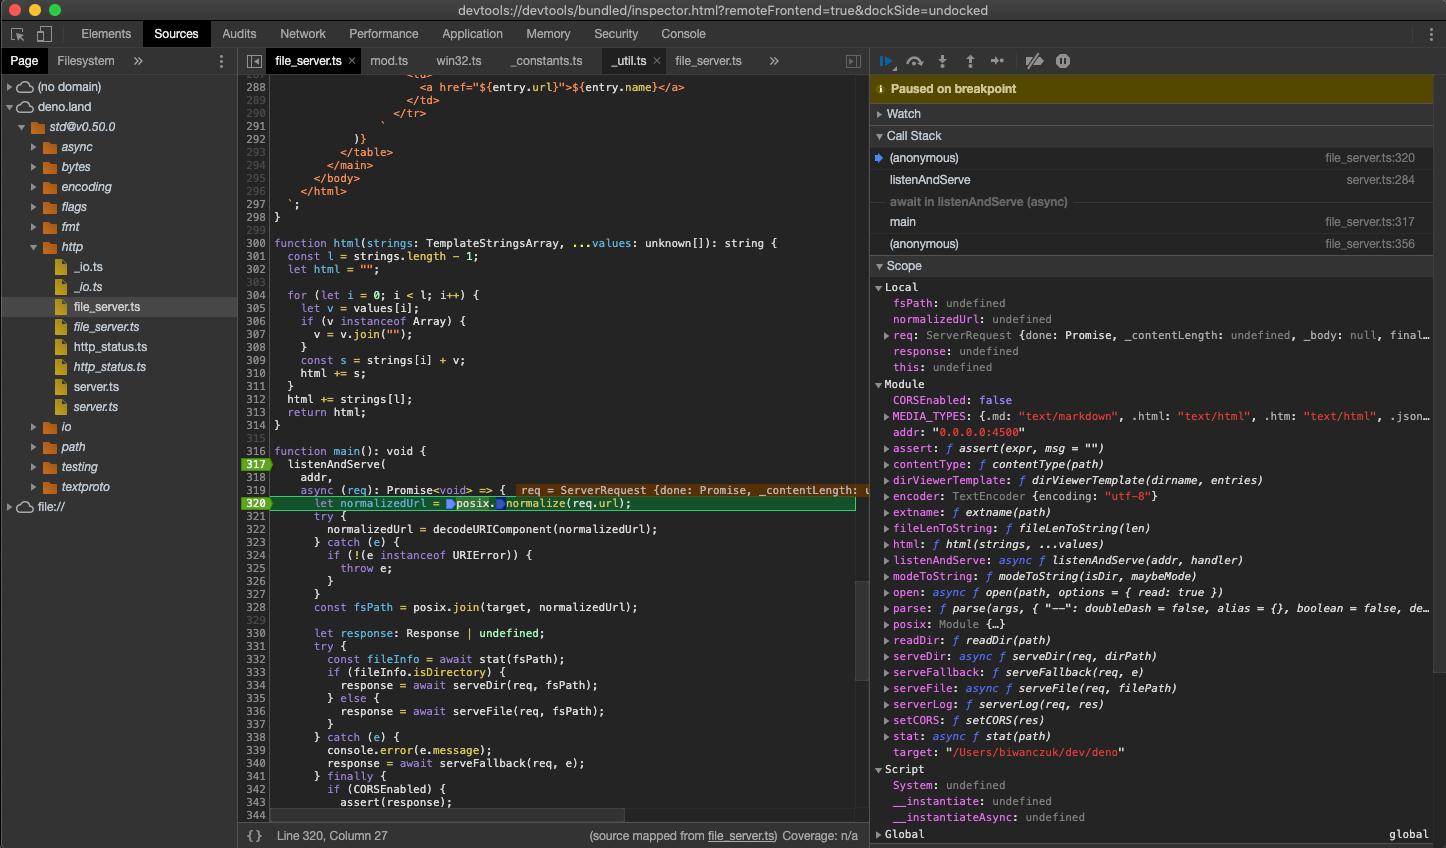
At this point all source code is available in the Devtools, so let's open up
file_server.ts and add a breakpoint there; go to "Sources" pane and expand the
tree:
Looking closely you'll find duplicate entries for each file; one written
regularly and one in italics. The former is compiled source file (so in case of
.ts files it will be emitted JavaScript source), while the latter is a source
map for the file.
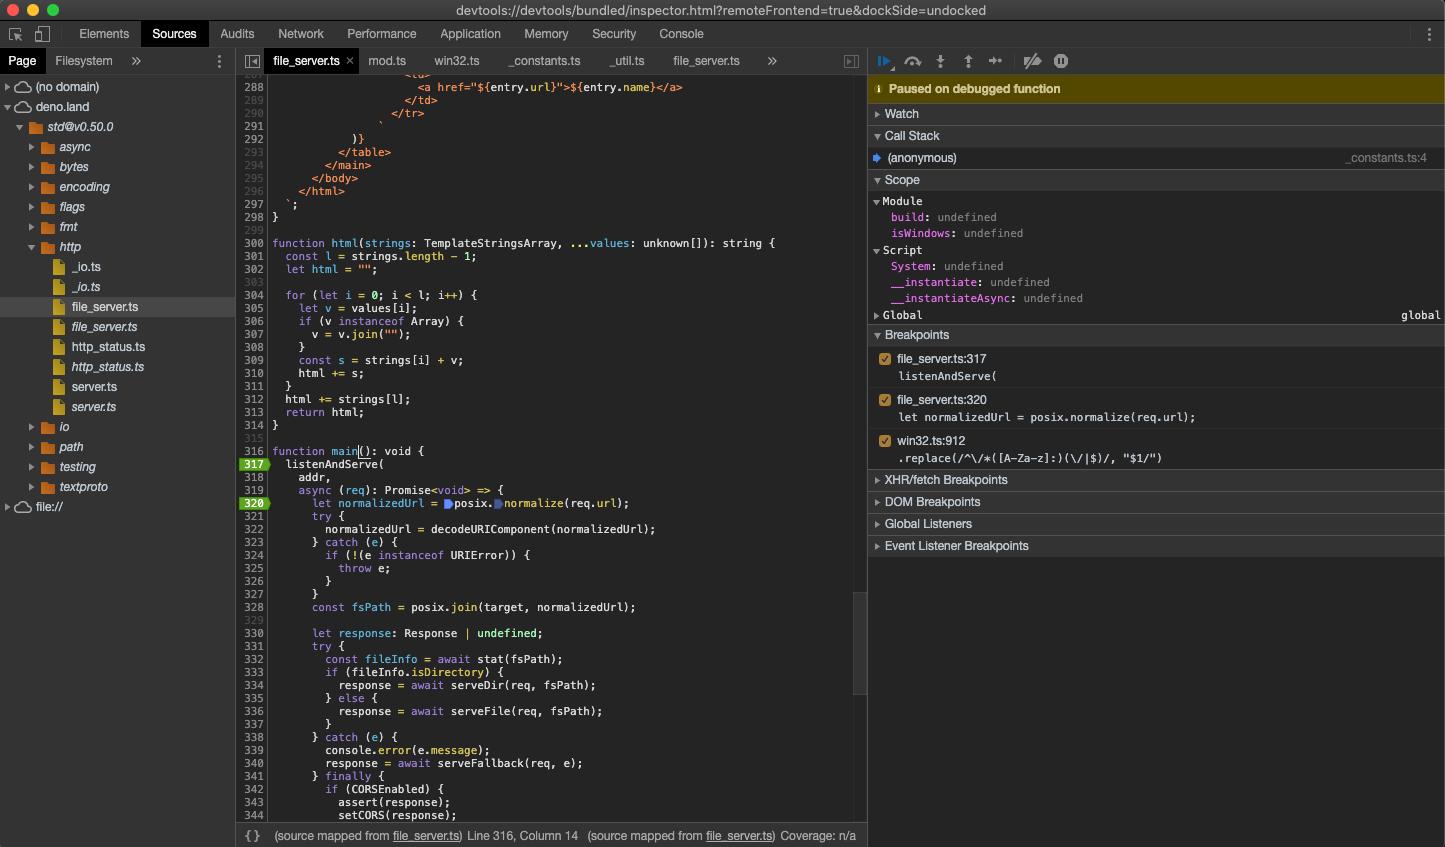
Add a breakpoint in listenAndServe method:
As soon as we've added the breakpoint Devtools automatically opened up source map file, which allows us step through the actual source code that includes types.
Let's send a request and inspect it in Devtools:
$ curl http://0.0.0.0:4500/
At this point we can introspect contents of the request and go step-by-step to debug the code.
VSCode
Deno can be debugged using VSCode.
Official support in plugin is being worked on - https://github.com/denoland/vscode_deno/issues/12
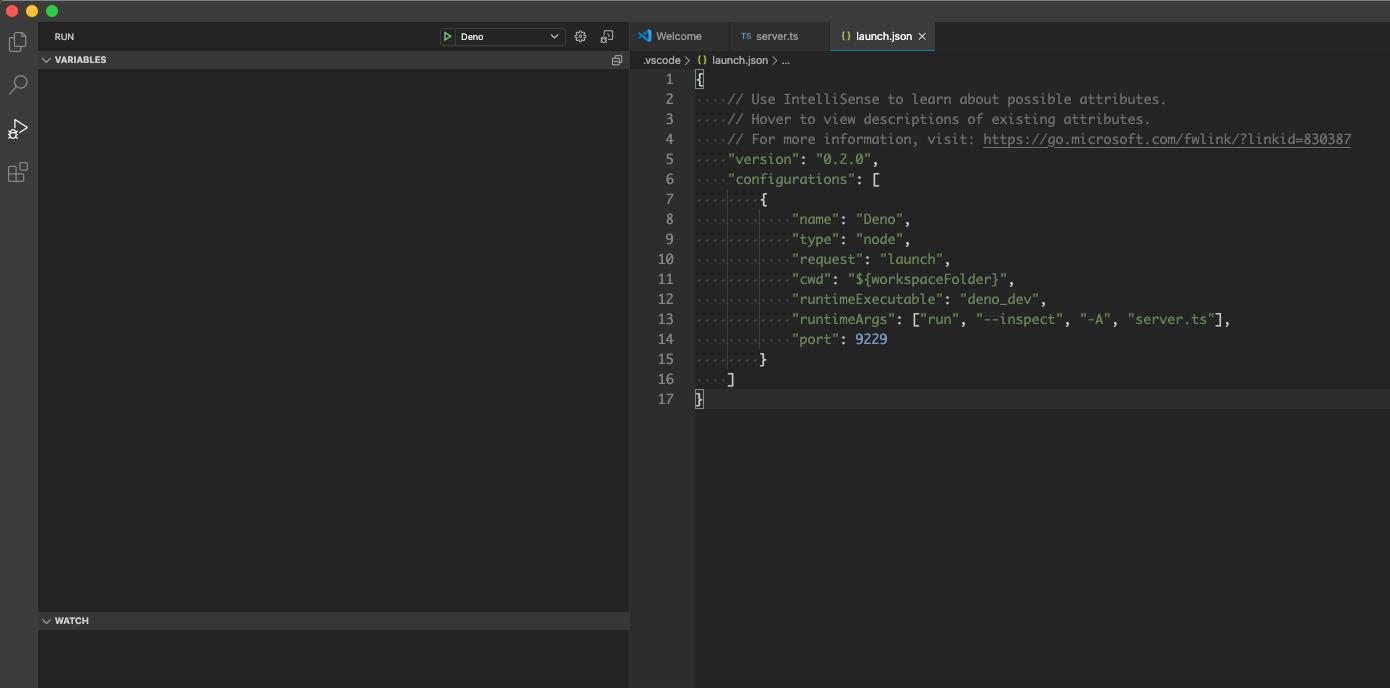
We can still attach debugger by manually providing simple launch.json config:
{
  "version": "0.2.0",
  "configurations": [
    {
      "name": "Deno",
      "type": "node",
      "request": "launch",
      "cwd": "${workspaceFolder}",
      "runtimeExecutable": "deno",
      "runtimeArgs": ["run", "--inspect-brk", "-A", "<entry_point>"],
      "port": 9229
    }
  ]
}
NOTE: Replace <entry_point> with actual script name.
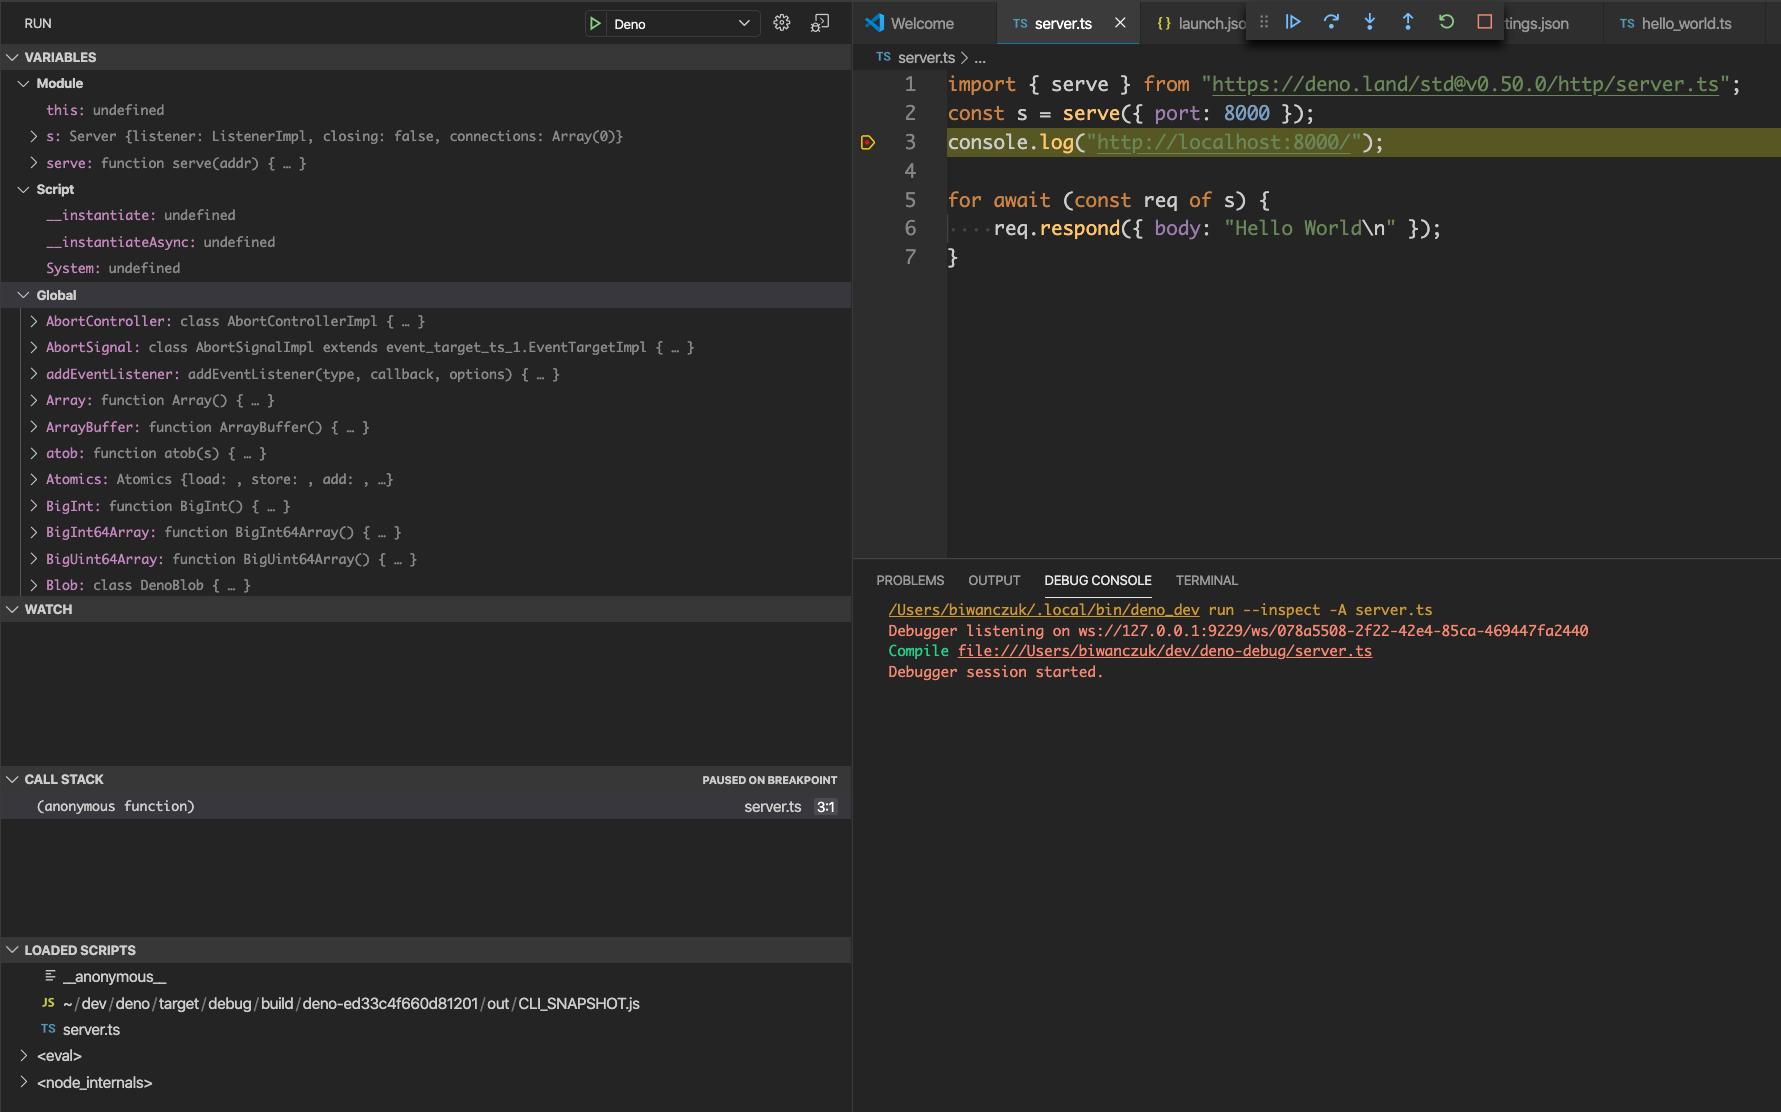
This time let's try with local source file, create server.ts:
import { serve } from "https://deno.land/std@v0.50.0/http/server.ts";
const s = serve({ port: 8000 });
console.log("http://localhost:8000/");

for await (const req of s) {
  req.respond({ body: "Hello World\n" });
}
Change <entry_point> to server.ts and run created configuration:
Other
Any client that implements Devtools protocol should be able to connect to Deno process.
Limitations
Devtools support is still immature, there are some functionalities that are known to be missing/buggy:
- autocomplete in Devtools' Console causes Deno process to exit
- profiling and memory dumps might not work correctly
